
Bitcoin Breaks Key Support, Analyst Signals Lower Levels Ahead
Bitcoin’s price action has fallen into bearish territory after dropping below an important previous low that had supported the rally for months. At the time of writing, Bitcoin is trading at $78,560 after falling to as low as $77,082 in the past 24 hours, a move that crypto analyst XForceGlobal says represents a significant change in the technical structure. According to his detailed Elliott Wave analysis shared on X, the price action has now invalidated the bullish framework many traders were relying on, and lower levels are becoming more likely in the coming weeks and months. Related....
Related News
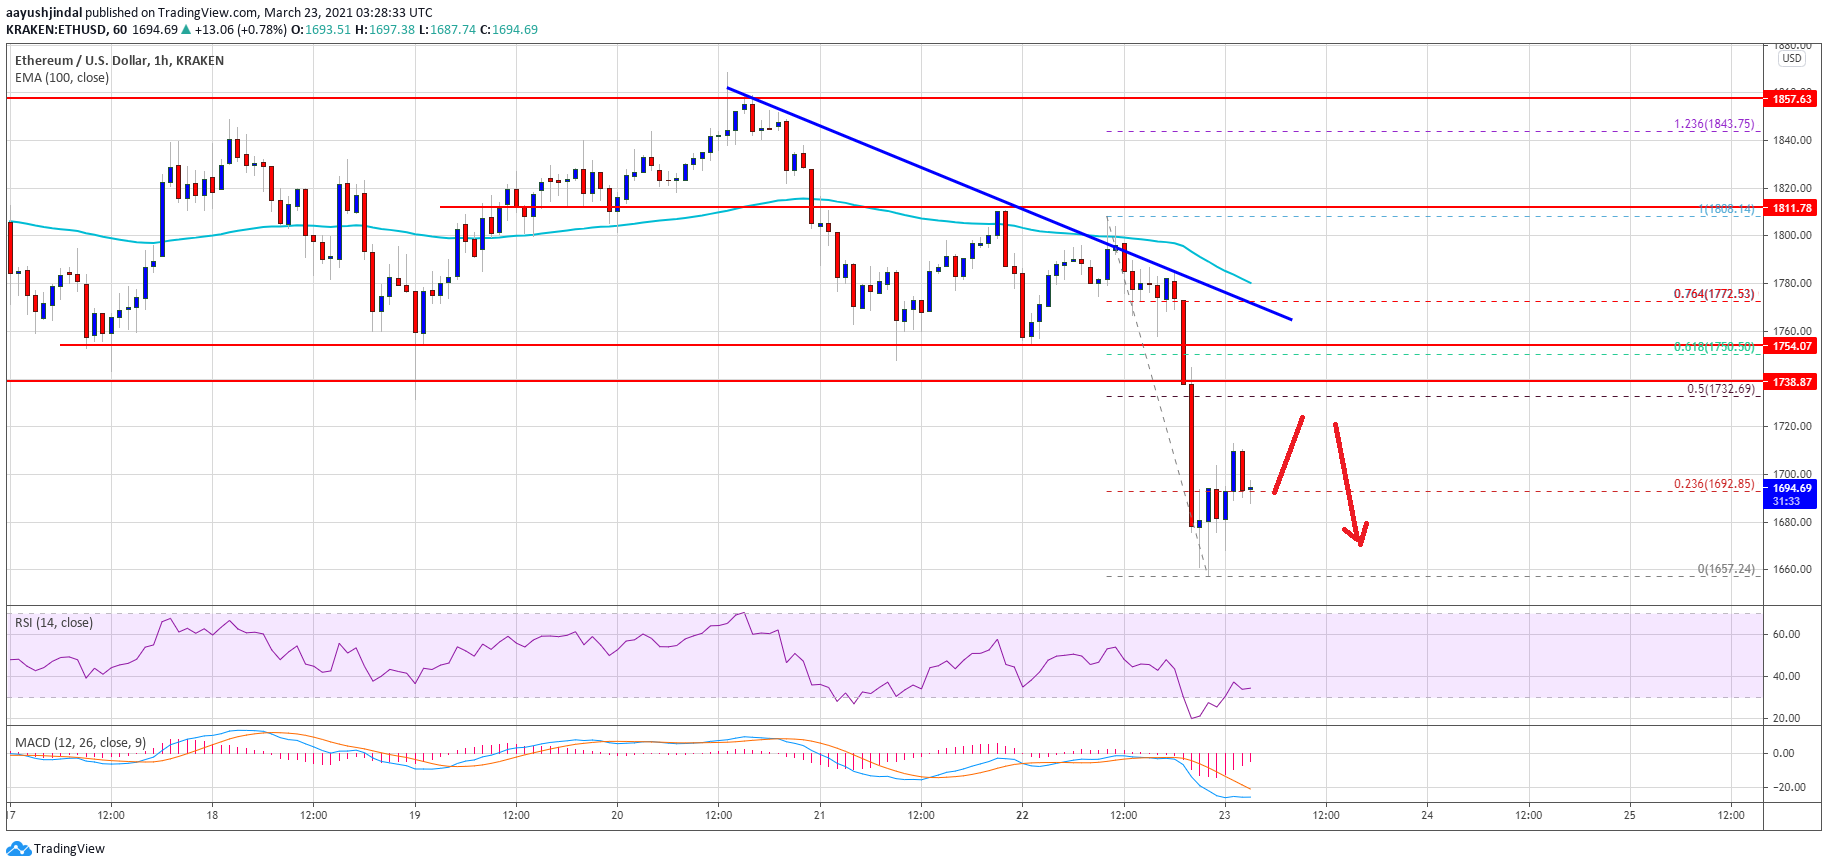
Ethereum broke the major $1,750 and $1,710 support levels against the US Dollar. ETH price is likely to continue lower below the $1,660 and $1,650 support levels. Ethereum failed to stay above the key $1,750 and $1,710 support levels. The price is currently trading well below $1,710 and the 100 hourly simple moving average. There […]

A cryptocurrency analyst has pointed out how the next XRP support may be $1.2 if the lower level of the asset’s Parallel Channel breaks down. XRP Is Currently Above A Parallel Channel’s Support Level In a new post on X, analyst Ali Martinez has shared a pattern that has been forming in the 3-day price of XRP. The pattern in question is a Parallel Channel, a type of consolidation channel in technical analysis (TA). Related Reading: Bitcoin Blasts To $92,000, Liquidating $182 Million In Shorts A Parallel Channel appears whenever an asset’s price consolidates between two....

Bitcoin currently trades for $13,800, establishing another floor as it looks to move even higher in the days ahead. The coin is below the daily highs of $14,100, set around 16 hours ago. Analysts think that Bitcoin could rip higher once it turns the $14,000 region into support. One trader went as far as to say that Bitcoin could see an “inverse capitulation.” Bitcoin Could Explode Higher if It Breaks $14,000, Analyst Says Bitcoin has […]

After ten months of decline, the only option for the Bitcoin price seems to be more downside. Analysis considers the state of the decline and defines confirmation signals for trend in the months ahead. Bitcoin Price Chart Overview. Two channels of price action imply two very different paths for price: The red channel, at first glance, seems to be the logical choice and implies a decline low around $200. If price does not break below the purple channel's lower trendline (with a caveat - see below) then, we face the prospect of an immediate advance. Fortunately, we don't have to guess....
The Bitcoin market has seen some consolidation since Monday, maintaining a price above the $56,000 mark after a brief drop from $65,000 to around $52,600 last Friday. However, one analyst suggests that the bearish sentiment may still be ongoing, with expectations of a potential revisit to lower levels before a significant upward movement. BTC’s Future Price Action In Focus Crypto analysts known as “VirtualBacon” on X (formerly Twitter) have raised concerns about an impending “huge Bitcoin shakeout.” In the coming 2-3 weeks, the analyst explains that Bitcoin could experience one last....