
XRP Price Holds Ground, But Can Bulls Push Momentum Higher?
XRP price is holding above $2.920 support zone. The price is now consolidating and might soon attempt a move above the $3.050 resistance. XRP price is showing bearish signs below the $3.080 resistance. The price is now trading near $2.980 and the 100-hourly Simple Moving Average. There was a break below a key contracting triangle with support at $3.020 on the hourly chart of the XRP/USD pair (data source from Kraken). The pair could continue to decline if it stays below the $3.10 zone. XRP Price Starts Consolidation XRP price started a downside correction from $3.0850, like Bitcoin and....
Related News

Bitcoin’s upwards momentum has stalled following the promising push higher seen yesterday This allowed the cryptocurrency’s price to surge up towards $10,800, which is where it met some serious resistance that slowed its uptrend Despite rejecting at this level, the subsequent downtrend has not been that intense, indicating that bulls may still have some underlying strength One analyst is noting that although BTC is beginning to look bearish, the fact that funding rates are still […]
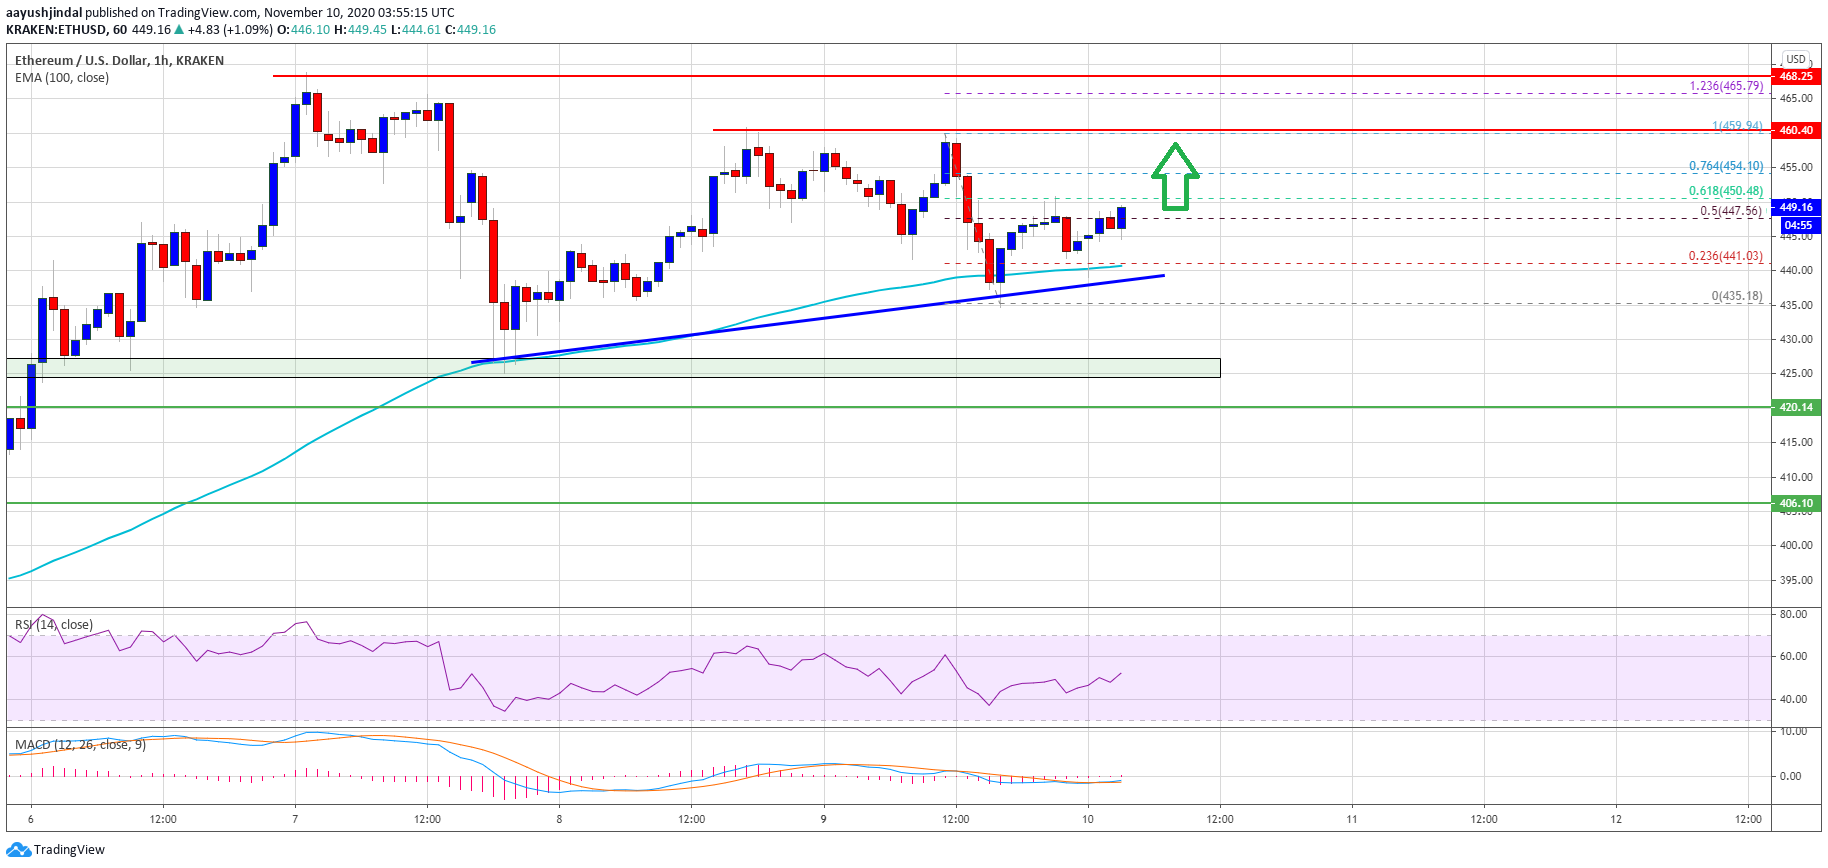
Ethereum corrected lower below $440, but it remained stable above $435 against the US Dollar. ETH price is likely to gain momentum if it clears the $460 resistance zone. Ethereum is holding the ground above the $440 and $435 support levels. The price is showing positive signs above the $440 support and the 100 hourly […]

Cardano’s (ADA) bullish momentum is losing steam as bearish pressure mounts, forcing the price to retreat from the critical $0.8119 level. After a promising attempt to push higher, ADA bulls are now struggling to maintain control, with sellers stepping in to reclaim dominance. The recent rejection of this key resistance suggests that downward pressure is building, raising concerns about whether the altcoin can hold its ground or slip further. With technical indicators hinting at growing weakness, the focus now is on the next support zones to determine if a deeper correction is on the....
Bitcoin price found support at a broken resistance level but indicators suggest that sellers still have a chance. The 100 SMA is above the longer-term 200 SMA so the path of least resistance is to the upside and the rally could carry on up to $470 or higher. In addition, the 200 SMA held as dynamic support in the past so it might continue to keep losses in check from here. However, stochastic is indicating overbought conditions and is turning lower so bitcoin price could follow suit. This could take price down to the near-term support at $450 once more or until $440. Stronger selling....
Solana is attempting to stabilize after recent downside pressure, with the $85 level emerging as a key support zone. Price action is beginning to show early signs of base formation as bulls try to defend this area and slow the broader decline. While the short-term structure hints at a possible recovery attempt, a stronger shift in momentum will likely require a decisive push toward higher resistance levels. Solana Shows Early Signs Of Stabilization Near Key Zone In a recent technical brief, MakroVision Research highlighted that Solana is beginning to display early signs of stabilization....