
XRP Price Continues Lower as Sellers Tighten Grip on Intraday Structure
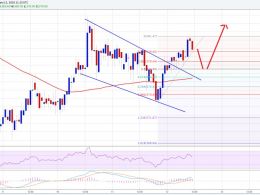
XRP price started a fresh decline from $2.350. The price is now showing bearish signs and might extend losses if it dips below $2.150. XRP price started a fresh decline below the $2.320 zone. The price is now trading below $2.30 and the 100-hourly Simple Moving Average. There is a short-term bearish trend line forming with resistance at $2.2550 on the hourly chart of the XRP/USD pair (data source from Kraken). The pair could continue to move down if it settles below $2.150. XRP Price Dips Again XRP price attempted a recovery wave above $2.320 but failed to continue higher, like Bitcoin and....
Related News

XRP is inching closer to a major turning point as fresh upward momentum collides with a developing, expanding diagonal structure. The recent impulse off support is starting to hint at a potential macro shift, raising expectations for a breakout-driven continuation if buyers can maintain control. Building Toward A Truncated Low: Market Structure Turns Complicated Hov recently highlighted a key shift in XRP’s structure, revisiting the outlook from the previous analysis where a potential push lower was expected to complete a truncated low. Since that discussion, XRP has dipped further,....
Bitcoin price is showing bullish signs on the lower time frame chart, but the daily chart is pointing towards a crucial break in the near term. Intraday Support Level can be at $374. Intraday Resistance Level may be $380. Bitcoin price remained under a lot of bearish pressure this week, as there was a monster resistance on the daily chart formed. The price continuously found sellers near the 100-day simple moving average (daily chart and data feed from HitBTC). It looks like a solid bearish structure formed on the daily chart, and if sellers gain control, then the price may head lower in....
Solana (SOL) is flashing warning signs after a sharp rejection at the $92–$94 supply zone halted its recent upside attempt. Momentum has quickly faded, with price now slipping back toward key support levels as sellers tighten their grip. With SOL caught between a weakening structure and critical support below, the risk of a deeper breakdown is growing, making the next move a decisive one for short-term direction. Solana Stuck In A Tight Range As Pressure Builds Ali Martinez highlights that Solana remains stuck within a well-defined consolidation channel, with price action compressing after....
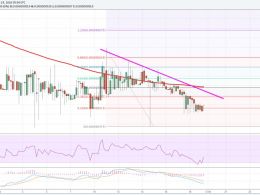
Dogecoin price recently traded above 60.0 Satoshis, where it found sellers and traded down. Can it continue heading lower? Intraday Support Level can be 50.0 Satoshis. Intraday Resistance Level may be 54.0 Satoshis. Dogecoin price this past week spiked above the 60.0 Satoshis area where it found sellers that pushed the price back down. The price is currently following a bearish path and it looks like it may continue in the near term. There are many hurdles formed for the bulls on the upside that can be seen as a sell zone. There is a bearish trend line formed on the 4-hours chart (data....
Ethereum’s recent pullback has added pressure to the market, but the broader technical structure continues to show signs of resilience. Despite the decline, ETH remains above several critical support zones, keeping hopes alive that the long-term bullish trend may still be intact if buyers can maintain control at these key levels. Ethereum Holds Above Critical 2022 Ascending Trendline According to The Boss, Ethereum’s broader market structure may still be holding firm despite the recent wave of selling pressure across the crypto market. Although ETH has experienced a steady decline over the....