
TA: Bitcoin Reaches Key Juncture, Why Recovery Won’t Be Easy
Bitcoin traded towards $41,200 before recovering against the US Dollar. BTC must clear $42,800 to start a fresh increase in the near term. Bitcoin extended decline and traded below the $42,000 support zone. The price is still trading below $43,000 and the 100 hourly simple moving average. There is a crucial bearish trend line forming with resistance near $42,780 on the hourly chart of the BTC/USD pair (data feed from Kraken). The pair could start a fresh increase if there is a clear move above the $42,800 resistance. Bitcoin Price Approaches Key Resistance Bitcoin price remained in a....
Related News

The party across global market might be coming to an end with Bitcoin positioned to be one of the assets with the potential to come on top. The shift in the U.S. Federal Reserve monetary policy will ripple across the stock market as interest rates spike and they reverse their asset purchase program. Related Reading | TA: Bitcoin Reaches Key Juncture, Why Recovery Won’t Be Easy At least, that’s how Mike McGlone, Senior Commodity Strategist for Bloomberg Intelligence views it. In a recent interview with Scott Melker’s “The Wolf Of All Streets” podcast, McGlone talked about Bitcoin as a....

Bitcoin has been facing some immense volatility throughout the past few days and weeks, with sellers stepping up and trying to invalidate the strength seen by the cryptocurrency as they hold it below the key $19,000 level. A sustained bout of trading below this level will certainly degrade its technical strength. Still, the intensity of […]
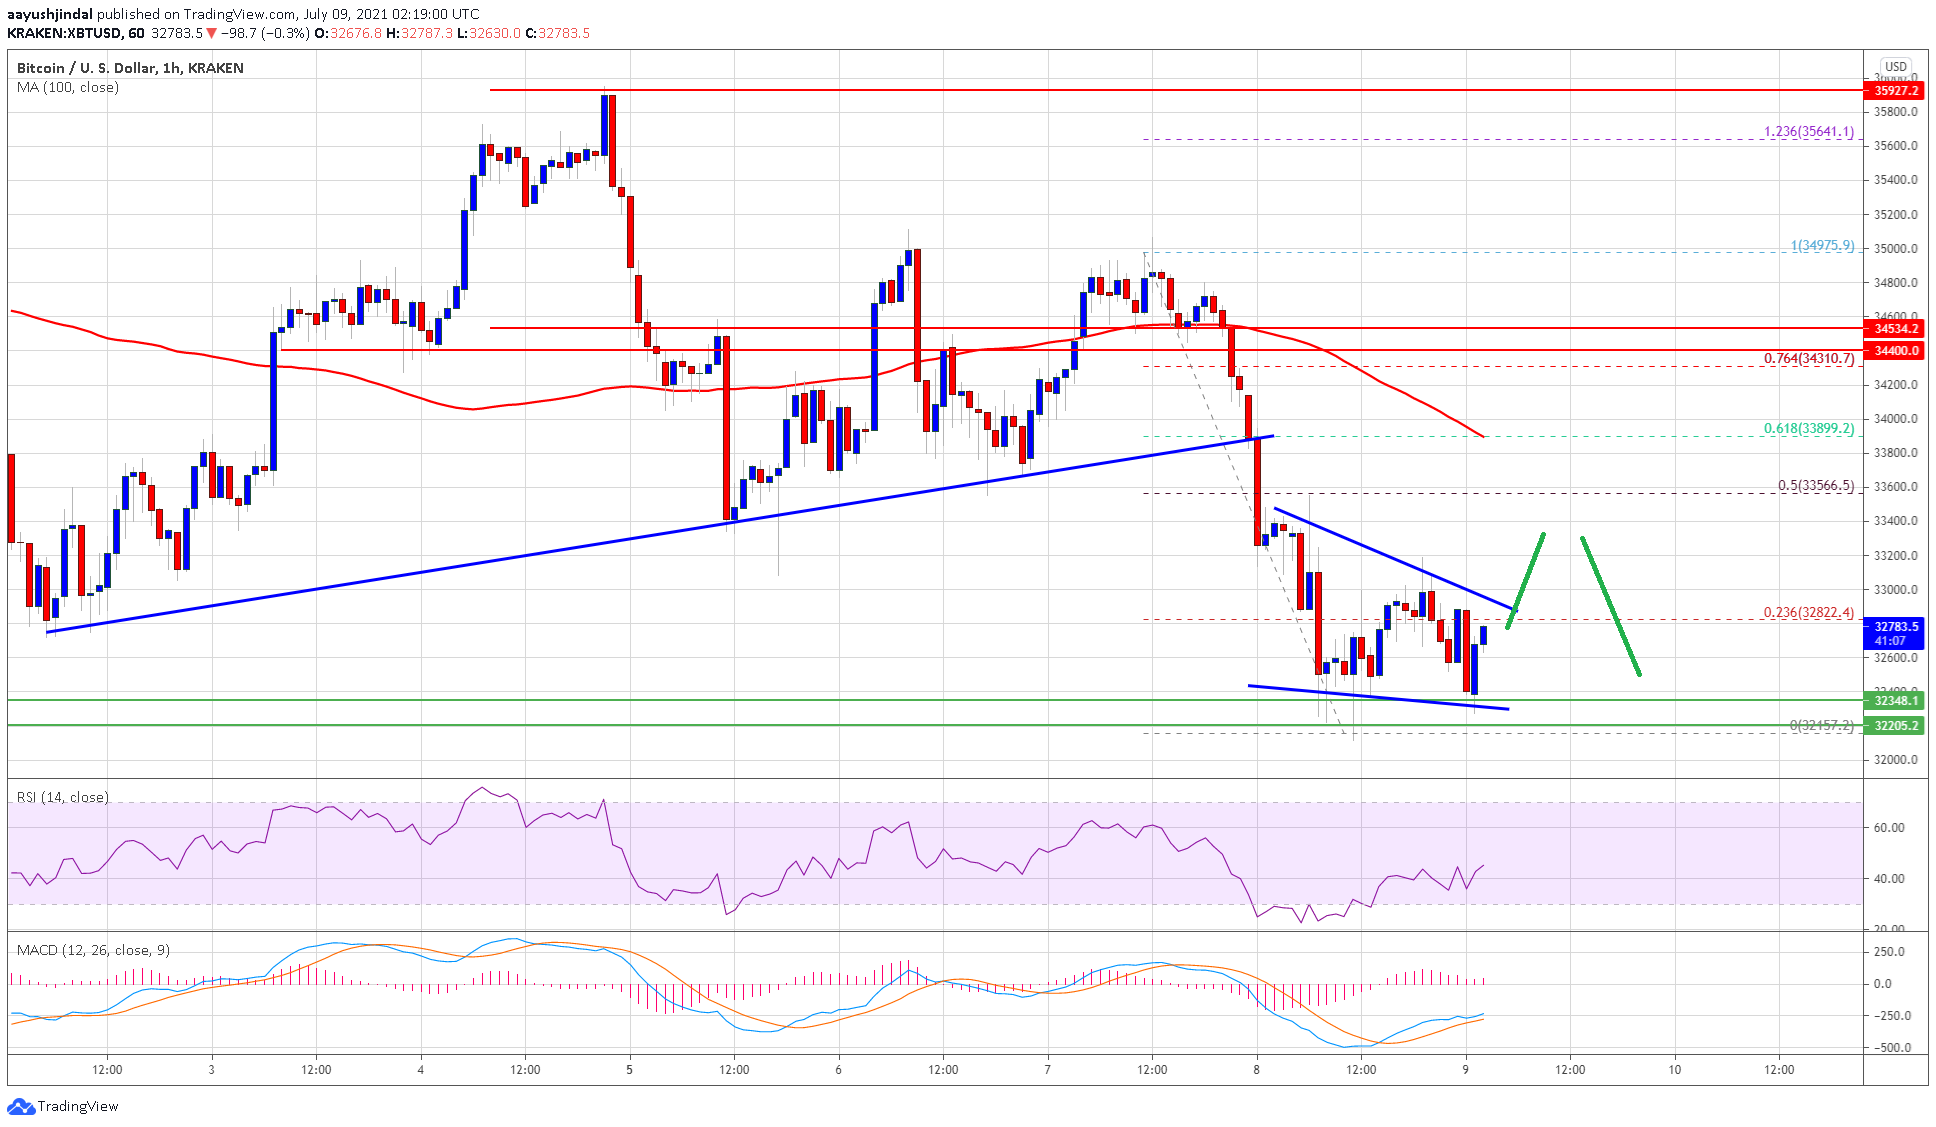
Bitcoin price extended its decline below the $33,500 support against the US Dollar. BTC is now consolidating above $32,200, below which it could accelerate lower. Bitcoin started a fresh decline below the $33,500 and $33,200 support levels. The price is now trading below the $33,000 support and the 100 hourly simple moving average. There is […]

Litecoin price is currently attempting a recovery. It looks like it won’t be easy for buyers to take the price back up as sellers remain in charge. Intraday Support Level on the downside can be at $3.00. Intraday Resistance Level may be at $3.10. Litecoin price suffered heavy losses this past week, as it traded down and test the $3.0 handle. There was even a break below the stated level, signaling that there is a lot of bearish pressure on the price. Looking at the hourly chart with the data feed from Bitfinex, the price traded as low as $2.90 before starting a recovery. The price managed....
Ethereum price fell sharply after testing the $7.80 resistance. It looks like a recovery in ETH/USD won’t be easy in the near term. Key Highlights. ETH price after correcting higher towards $7.80 against the US Dollar found sellers and traded lower. The downside move was prevented by a bullish trend line formed on the hourly chart (data feed via SimpleFX) of ETH/USD. The price may continue to struggle since there is a lot of selling pressure examined. Ethereum Price Support. We saw how there was a recovery in ETH price versus the US Dollar yesterday, but the price could trade higher for....