
XRP Price Downtrend Extends — Sellers Target Fresh Lows After Support Break
XRP price started a fresh decline below $2.50. The price is now showing bearish signs and is at risk of more losses below $2.30 in the near term. XRP price gained bearish momentum and traded below $2.350. The price is now trading below $2.420 and the 100-hourly Simple Moving Average. There is a bearish trend line forming with resistance at $2.550 on the hourly chart of the XRP/USD pair (data source from Kraken). The pair could start a recovery wave if it stays above $2.30. XRP Price Dips Further XRP price remained in a bearish zone below $2.550 and extended losses, like Bitcoin and....
Related News
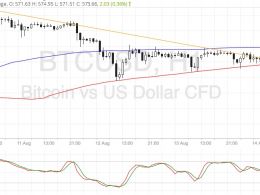
Bitcoin price could continue to drop after completing a correction to the area of interest at $580. Bitcoin Price Key Highlights. Bitcoin price is still trending lower on its short-term charts, following a break below consolidation and reversal formations. Price could pull up to the descending trend line on the 1-hour chart before resuming its slide, giving sellers an opportunity to catch the downtrend at a better price. Technical indicators are confirming that a downtrend could be in the works. Technical Indicators Signals. The 100 SMA is making a downward crossover from the 200 SMA to....

Ethereum Price Key Highlights. The downtrend on ethereum price action appears to be slowing down, as bears don't seem to be too eager to take it down to new lows. After breaking below the earlier triangle consolidation pattern, ethereum price seems to be losing momentum and might be in for a short squeeze around the recent levels. Ethereum price might need to make a correction from its recent drop in order to draw more sellers to push for new lows. RSI Bullish Divergence. Technical indicators appear to be showing that a rally is about to take place, as RSI is reflecting downtrend....

Ethereum Price Key Highlights. Ethereum price just finished testing the downtrend line resistance visible on the 1-hour chart and is starting to gain additional momentum heading back south. The 50% Fibonacci retracement level held as resistance on the pullback, putting ethereum price back on track towards the previous lows at 0.00156BTC. Ethereum price is resuming its impulse wave on the ongoing downtrend, possibly gearing up to test the previous lows or establish new ones. New lows in sight? Technical indicators are reflecting a return in bearish pressure, which suggests that sellers....
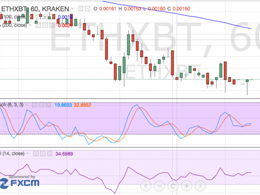
Ethereum Price Key Highlights. Ethereum price is still struggling to pick up its pace in the downtrend, as another consolidation pattern formed on the short-term time frame. Price is stuck inside a descending triangle pattern, with sellers trying to gain enough energy to push for a downside break of support around 0.00160BTC. Ethereum price is able to carry on with its ongoing selloff, although sellers appear to be having difficulty taking it down to new lows. Potential triangle breakout. For now, ethereum price is testing the triangle support but several spikes have formed, which suggests....
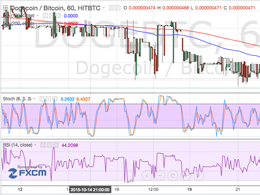
Dogecoin Price Key Highlights. Dogecoin price did indicate further downside momentum, as predicted in an earlier technical analysis write-up on the consolidation pattern repeating itself. With the downside break, more sellers could hop in the ongoing downtrend and push dogecoin price to new lows. Dogecoin price confirmed the buildup in bearish pressure with a strong downside break below the consolidation pattern on its 1-hour chart. Where To Next? Price has broken below the previous lows in October 21, hinting that bears are unstoppable at this point. Stochastic and RSI are both on the....