
Bitcoin Price Technical Analysis for 29/5/2015 - Hitting the Resistance
The consolidation in Bitcoin has been prolonged as neither the bulls nor the bears are interested in exerting pressure at the moment. With price action staying muted, these are definitely testing times for the traders who are positioned in this sideways market. Bitcoin is marginally positive from yesterday, rising 0.2% to $235.88. Technical analysis of the 240-minute BTC/USD price chart reveals that even as the cryptocurrency hits the resistance for the third time, the momentum is tilted in favor of the sellers. Bitcoin Chart Structure - The chart above tells that Bitcoin recently made the....
Related News

In my prior analysis, Finally, a Breakout!, I had mentioned that Bitcoin may rise further to challenge the previous strong support level of $231. The price did advance to $230.79 followed by minor booking, which has brought the price down to $228.49. With Bitcoin unable to overcome the supply pressure near the resistance level, it becomes important to question whether it remains a buy on dips candidate or not. Let's find that out with the technical analysis of the 240-minute BTC/USD price chart below. Bitcoin Chart Structure - As can be seen from the chart above, Bitcoin first retested the....

As discussed in yesterday's analysis titled Rebound Likely, Bitcoin has surged to $262.68 after hitting a high of $265.95. The big question now is: Has the selling abated? As can be seen from the 240-minute BTC/USD price chart, Bitcoin has hit a key resistance level of $265, marked as Resistance Line 1. A breakout above this line will set the next target at the Resistance Line 2, i.e. at $280. Now, let's get to what the technical indicators are saying. Moving Average Convergence Divergence - The MACD indicator value of -6.8775 is languishing near yesterday's lows. The Signal Line has also....

In my previous analysis titled More Downside Possible, I had mentioned of a bearish Head and Shoulders Pattern which had set the downside Bitcoin target at $260. Bitcoin did fall to $263 before rising again to challenge the broken neckline support and hitting an intraday high of $273. Bitcoin can be seen trading up 1.19% at $267.69. The latest price action in Bitcoin has made it incredibly difficult for an analyst to tell a direction. The technical indicators overlaid on the 240-minute BTC-USD price chart also fail to provide any significant clues to the future course of action. Bitcoin....

The ongoing spree of extremely thin trading sessions has taken many market participants by surprise. After hitting levels of sub-$200, Bitcoin raced back up to hit $235-237 but very few would have expected the cryptocurrency to have gone tight-ranged since then. Bitcoin is currently trading at $229.14, up 0.94 percent as the bulls manage to keep the price hovering near the resistance. As Bitcoin continues to trade near the recent highs, expectations are rising that the cryptocurrency may eventually pierce the resistance, but let us find out what the latest technical indications are.....
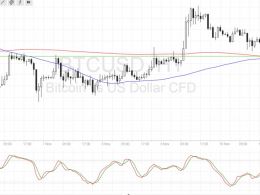
Bitcoin price pulled back from its recent rally and is finding support at a former resistance level. Bitcoin Price Technical Analysis. Bitcoin price is currently testing an area of interest and might be due for a bounce. The broken resistance around $715 is holding as support for the time being. Technical inflection points are also lining up with this area of interest. Technical Indicators Signals. The 100 SMA just crossed above the longer-term 200 SMA so the path of least resistance is to the upside. In addition these moving averages coincide with the former resistance around $715, adding....