Bitcoin Price Technical Analysis for 04/28/2016 – Bears Are Back!
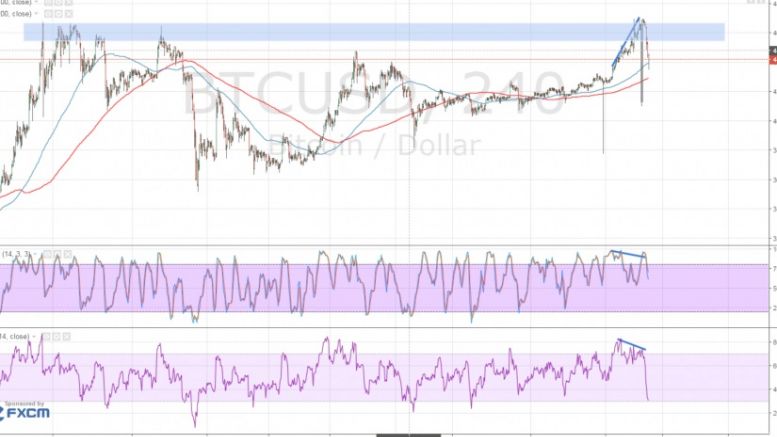
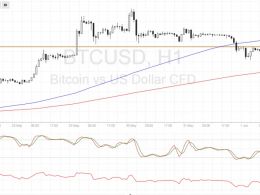
Bitcoin price turned upon hitting the resistance at $460 as hinted by the bearish divergence. The oscillators fell from the overbought regions to indicate a return in bearish momentum. RSI is nearing the oversold area so profit-taking might happen but stochastic has a long way to go, which suggests that sellers could be in control for a long while. However, the 100 SMA is still above the longer-term 200 SMA so a bounce is still possible. Bitcoin price is still on top of the trend line drawn to connect the lows since late January this year so the uptrend could resume from here. Volatility....
Related News
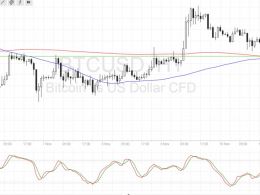
Bitcoin price pulled back from its recent rally and is finding support at a former resistance level. Bitcoin Price Technical Analysis. Bitcoin price is currently testing an area of interest and might be due for a bounce. The broken resistance around $715 is holding as support for the time being. Technical inflection points are also lining up with this area of interest. Technical Indicators Signals. The 100 SMA just crossed above the longer-term 200 SMA so the path of least resistance is to the upside. In addition these moving averages coincide with the former resistance around $715, adding....
Ethereum price traded down finally and also moved back below $10.0. It looks like there is a chance of a minor correction moving ahead. Intraday Support Level can be $9.07. Intraday Resistance Level may be $10.5. Ethereum price as highlighted yesterday made a new high of $11.98 where it found sellers and started to move down. The price also traded below the $10.0 level, which is a sign that bulls stepped back and failed to prevent losses. If the bears manage to gain strength, then there is a chance of more losses in the near term.
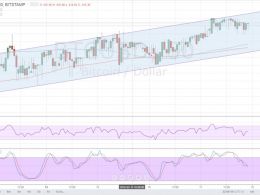
Bitcoin price has started a steady uptrend and might carry on, based on the new signals from technical indicators. The 100 SMA just crossed above the longer-term 200 SMA to confirm that the path of least resistance is to the upside. However, the channel resistance appears to be holding so a pullback to these dynamic support areas near the bottom of the channel might take place. RSI is on its way down, indicating that bitcoin price bears are in control of price action for now. In that case, a quick drop to the channel bottom is indeed possible, as stochastic is also heading down from the....

Bitcoin remains at the same price level from last week, reinforcing the $600 support area for the entire new cycle. Meanwhile, technical analysis indicates that bullish consensus is getting stronger, increasing the likelihood of a rally from $650 to $820. 5th Elliott Wave forecasting, based on Fibonacci numbers, could be calculated to the technical objective around the $820 area, where several theories point to the delayed next stage. From there, a technical correction should send prices back to $700, giving stragglers a second chance to recalculate their strategies to join. After another....
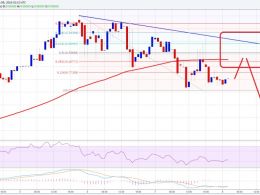
Bitcoin price appears to be correcting from its recent selloff but technical indicators are signaling that a longer-term bounce might be in order. Bitcoin Price Key Highlights. Bitcoin price is pulling up from its recent slide but could be in for more gains if sellers hop in the short-term area of interest. Support at $555 was previously broken and might hold as resistance moving forward. Technical indicators, however, are suggesting that the climb could continue. Technical Indicators Signals. The 100 SMA is safely above the 200 SMA so the path of least resistance is still to the upside.....