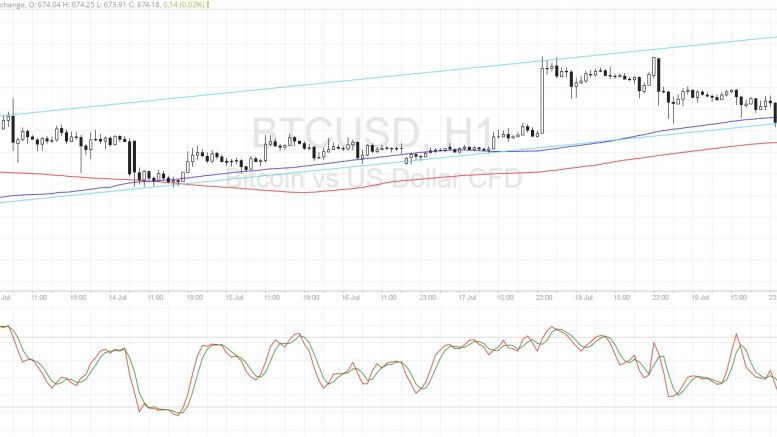
Bitcoin Price Technical Analysis for 07/20/2016 – Steady Uptrend
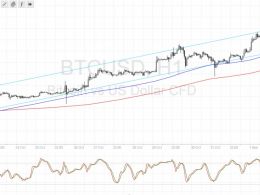
Bitcoin price found support at the bottom of its ascending channel and looks prime for another test of resistance. Bitcoin Price Key Highlights. Bitcoin price went for a test of the channel support as predicted in an earlier article and a bounce took place. This signals that price could be headed back to the channel resistance to carry on with its uptrend. A fresh round of risk aversion could keep bitcoin in demand but technical indicators are giving mixed signals. Technical Indicators Signals. The 100 SMA is above the 200 SMA so the path of least resistance is to the upside. This suggests....
Related News
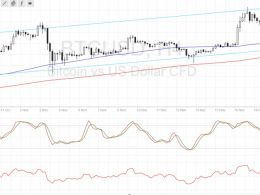
Bitcoin price could be in for a drop from the channel resistance, offering another chance to buy on the dips to support. Bitcoin Price Key Highlights. Bitcoin price is still trading inside its short-term ascending channel and is currently testing the resistance. Reversal candlesticks have formed at this level so it’s likely that bulls could book profits and trigger another dip to the channel support. Technical indicators are showing that the uptrend could continue but that a pullback is due. Technical Indicators Signals. The 100 SMA is above the longer-term 200 SMA so the path of least....
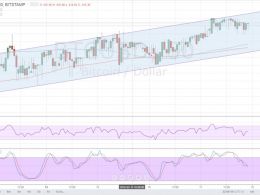
Bitcoin price is pulling back from its ongoing uptrend, offering bulls a chance to go long at cheaper levels. Bitcoin Price Key Highlights. Bitcoin price retreated upon testing its yearly highs, allowing the correction to materialize as predicted in the previous post. An ascending channel can be seen on the 4-hour bitcoin chart, and price is approaching the floor. Technical indicators are showing that the climb is likely to resume rather than reverse. Technical Indicators Signals. The 100 SMA is above the longer-term 200 SMA on the 4-hour chart, confirming that the path of least resistance....
Bitcoin price has started a steady uptrend and might carry on, based on the new signals from technical indicators. The 100 SMA just crossed above the longer-term 200 SMA to confirm that the path of least resistance is to the upside. However, the channel resistance appears to be holding so a pullback to these dynamic support areas near the bottom of the channel might take place. RSI is on its way down, indicating that bitcoin price bears are in control of price action for now. In that case, a quick drop to the channel bottom is indeed possible, as stochastic is also heading down from the....
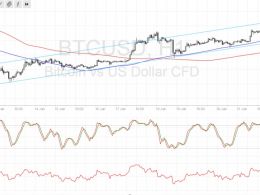
Bitcoin price is still keeping up its uptrend but bulls seem to be having a difficult time pushing for more gains. Bitcoin Price Key Highlights. Bitcoin price is still crawling inside its ascending channel pattern visible on the 1-hour time frame. Price seemed to make a downside break from support but the dynamic inflection points held as a floor and kept it on an uptrend. Technical indicators seem to be hinting that the climb could carry on, albeit at a slow pace. Technical Indicators Signals. The 100 SMA is above the longer-term 200 SMA so the path of least resistance is to the upside.....
Bitcoin price could be starting a new uptrend but it needs to find support at the nearby Fib levels before confirming this climb. Risk-on flows appear to be supporting the cryptocurrency and weighing on dollar demand. Bitcoin price appears to be starting a new trend on its short-term time frames, as an ascending trend line can be drawn to connect the recent lows of price action. Technical indicators are also hinting at a start of a short-term uptrend, with the moving averages looking prime for an upward crossover. Using the Fibonacci retracement tool on the latest swing high and low....

